
Diagrams, and specifically graphs, form the basis of many modern data and analytics functions for finding relationships between people, places, things, events, and locations in different data sets. Data&Analytics executives rely on graphs to quickly answer complex business questions that require contextual awareness and an understanding of the nature of connections and strengths across multiple entities.
Gartner predicts that by 2025, graph technologies will be used in 80% of data and analytics innovations (up from 10% in 2021) to enable rapid decision making across the enterprise.
It quickly becomes clear that in logistics, where the very rapid decisions just mentioned are part of everyday life in conjunction with complex business issues, the use of graph databases can become a competitive advantage. But to do this, we first need to clarify what exactly graph databases are.
What is a graph database?
In today’s extremely interconnected, digitized world, more and more data is being left behind. In addition to the sheer number, the extent of the links between the data itself is also increasing, as is the number of different data types. Conventional databases are usually relational, which means they store data separately by data type in tables. They are not designed for interrelated data. Graph databases, on the other hand, can make data correlations based on graphs visible, relate them to each other and evaluate them.
Graph databases are used, for example, to evaluate user relationships in social networks such as Facebook or the purchasing behavior of users in e-commerce. But they can also be helpful in supply chain management.
Advantages of graph databases for the supply chain
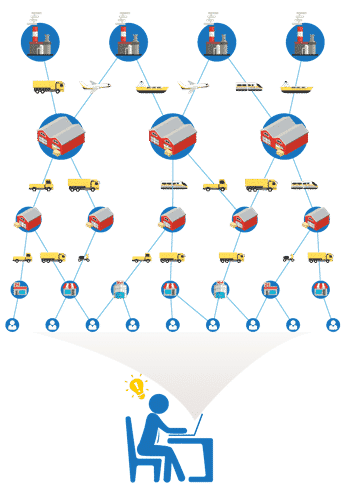
Supply chains are often complex structures that encompass various levels. They extend from the manufacturer through processing companies to the dealer who sells the finished product to the end customer. Take the automotive industry, for example: In this sector, manufacturers use a multi-layered and widely ramified network of suppliers, dealers and partners who cooperate on a global scale. The supply chain does not run in a straight line, but continues across several levels. Ensuring 360-degree transparency here is an enormous challenge.
 But especially in the event of a crisis, end-to-end traceability offers many advantages. If, for example, a manufacturer has to launch a recall campaign and identify all products containing the part affected by the recall, graph databases are a great help. They can graphically represent highly interconnected or even unstructured information and allow not only multiple linear links, but also links in all directions between the different actors in a supply chain.
Graph databases can thus show interrelationships of a supply chain and identify all direct and indirect neighbors of a product, component or supplier. This means that large volumes of data can not only be searched and managed in a structured manner, but can also be easily modified and new data of various types added, such as new legal regulations or new suppliers and products.
Another advantage of graph databases is their performance. The query speed can be 100 to 1,000 times faster compared to relational databases, depending on the use case.
Graph databases improve supply chain transparency
Companies have gigabytes or even terabytes of relevant supply chain data, but it is scattered far and wide throughout the organization. Graph databases are ideal for organizing and visualizing this data as an integrated whole because they directly map the network. In addition, graph analysis gives the ability to ask deep and complex questions that encompass not only the individual data points, but also the relationships between all the interacting links in the chain.
Supply chain data analysis requires the merging of different types of data from internal and external sources. Linking this data then allows supply chain managers to take advantage of the graph.
Consider the example of a factory A receiving a material X from warehouse B.
You can present this as a simple case or a more detailed case, depending on the requirements within the company and the amount of resources you have to build a database.
Simple case: warehouse B -(delivers X to)- factory A.
This level of detail may be sufficient for some purposes, but it leaves some gaps in the process, such as transportation logistics, inventory, order management, and contract fulfillment, which arguably defeats the purpose of supply chain management. If the company networked more information, it would have better insight into its supply chain and could find more optimal solutions.
Complex case: factory A -sends- purchase order -to- supply management system -checks- main stock list (which of several warehouses or suppliers could deliver X at the lowest cost, taking into account inventory levels, transportation costs, and contractual obligations?) -allocates- purchase order -to- warehouse B (or supplier B if it is an external organization) which in turn -transfers- material X -to- courier -delivered to- factory A.
This workflow factors in additional steps such as scheduling transportation, creating bills of lading, combining orders and receiving the shipment from Plant A, which temporarily stores the material, or passing it on to the production line. Yes, even internal processes can be mapped in this system.
The more granular you get, the more data is collected and the more steps in the supply chain are subjected to analysis. And after collecting this data, graph algorithms can be used to analyze it.
Conclusion
The use of graph databases in supply chain management is certainly something for already advanced companies and is not at the beginning of the digitization of logistics. But today, innovative supply chain companies are already using this advanced analytics method to augment existing supply chain management systems, quickly capture terabytes of data, and gain unprecedented insight into their entire operations. In this way, they are using graph databases to gain huge advantages over their competitors.